To use the DustEx model for exposure calculations, input is required for different aspects of the exposure simulation.
These aspects include :
- The indoor environment (residence)
- The product/emission
- Dust properties
- Substance properties
- Properties of indoor surfaces/sinks
- Airborne particulate matter properties
- Properties of the exposed population
- Simulation parameters for exposure (duration, frequency, and absorption)
For the simulation parameters, input values need to be entered into the DustEx web application. In practice, data for many of these parameters is scarce.
To assist in performing exposure assessments with the DustEx model a compilation of available information for the most critical simulation parameters is made. Based on this information, for a number of generic parameters (i.e. parameters that do not depend on the substance and product for which the assessment is conducted) defaults are suggested in the web application. The default values are chosen in such a way that they tend to lead to a conservative estimate of exposure. Information and suggested input can be accessed online using the ? buttons next to the parameter input fields in the DustEx web application.
For a number of parameters, the input can be entered to the model as a distribution, using the ^ buttons next to the parameter input fields. In this way an uncertainty analysis of the exposure assessment can be performed. A brief discussion on how uncertainty analysis of the exposure assessment can be conducted is described in the section “Probabilistic uncertainty assessment”.
Simulation duration
The period over which emission, transfer and exposure are calculated. Starts with the introduction of the product in the indoor environment and ends when the exposure stops. Typically SVOC emission and distribution processes are slow and take months or years to reach(quasi-) steady states. Simulation durations should be chosen between 10 and 999 days
Exposure frequency
The DustEx model calculates concentrations in indoor air compartments air, airborne particles and dust. Exposure is evaluated by combining the simulated concentration data with the presence of a person in the environment. This presence is specified by the exposure frequency: the number of times a person enters the indoor environment starting with the ‘start of exposure’. Exposure is assumed to take place at regular times separated by a constant interval.
Start of exposure
The first time a person enters the indoor environment after introduction of the product.
Exposure duration on day of exposure
The number of hours a person spends indoors on the day of exposure.
Exposure
- Oral absorption fraction
The fraction of the substance that will be absorbed (reaches the blood) via the GI-tract.
- Dermal absorption fraction
The fraction of the substance that will be absorbed (reaches the blood) via the skin.
Monte Carlo simulation
The number of iterations should be between 1,000 and 10,000.
Semi-volatile substances
The DustEx model models the transfer of a substance from a product or material into different indoor compartments air, airborne particulate matter, surfaces and dust after emission of the substance into air. The model is intended to be used for semi-volatile substances (SVOCs). In the context of DustEx these are defined as substances having a log10 Koa between 7 and 13. For more volatile substances (with a lower Koa) transfer into indoor compartments other than air will be limited. For this reason the lower limit of log10 Koa has been set to 7. For substances with a lower volatility (higher Koa) transfer into the indoor environment will not be via evaporation from the product but rather via other processes such as abrasion and wear of the product. These processes are not included in the model and therefore the Dustex model is not suitable to use for substances with log10 Koa higher than 13.
Long exposure periods
Emission and transfer processes of SVOCs indoors are slow. Typically, for continuously emitting sources, steady state concentrations are reached after periods of weeks to months or even longer. For this reason, the DustEx model focuses on calculating concentration profiles and exposures over longer periods. The duration of exposure simulations in DustEx are therefore limited to be between 10 days and 999 days.
Air as transfer medium
The DustEx model includes a number of emission and transport processes. Most importantly, air is assumed to be the transfer medium of the substance between different indoor compartments. There are indications that airborne particles may act as a transport medium as well. The presence of airborne particles may increase the mass transfer of the substance from a product into air by as much as a factor of 5 (Benning et al., 2013). Furthermore, dust deposition and resuspension is a process that allows additional exchange between the airborne particle and dust compartments. The processes of dust and airborne particles as transport medium are not included in the model. The impact of this limitation is expected to be mainly on the mass transfer of the substance from the product into air. To remedy this limitation, the mass transfer coefficient could be adjusted to higher values.
Clothing
Dermal absorption of the substance from air is modelled, assuming transfer of the substance from indoor air in gaseous phase across the system of the stratum corneum and the epidermis. The effect of clothing is not included in the model. The role of clothing is subject of ongoing research. The first indications are that clothing provides limited protection from SVOC exposure, and may under circumstances even lead to increased dermal absorption (Morrison et al., 2016). In view of this, the DustEx assumption that wearing of clothing will not reduce dermal absorption from air, seems reasonable.
Overall
In general there will be significant uncertainties in both the model’s accuracy and in the data availability for input parameters. In practical applications of the DustEx model, it is advised to accompany the exposure assessment with an analysis of the uncertainty in the assessment.
In practice, for many of the input parameters of the DustEx model only limited information will be available. As a consequence, exposure assessments with the DustEx model will contain uncertainty. As a matter of good practice, an exposure assessment should be accompanied with an assessment of uncertainty. Uncertainty assessments can be conducted using various methods with varying degrees of sophistication. The DustEx model supports a probabilistic evaluation to quantitatively assess uncertainty: the 1-dimensional Monte Carlo simulation (‘1D MCA’).
In 1D MCA, the assessor specifies the value of an input parameter as a probability distribution reflecting that the true value of the parameter is not known, but that it may take on a range of values with different probability. The 1D MCA consists in repeatedly sampling random values from the input distributions and calculating daily average doses for each sample. This results in a distribution of the calculated daily dose, representing the uncertainty in the calculated exposure as a result of uncertainty in the input values.
Distributions of parameter values are specified by pressing the Distributions button ^ . This opens the Distribution editor, where a distribution type can be chosen (none, uniform, normal, log–normal or triangular) and parameters to define the distribution can be specified.
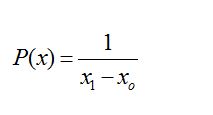
Uniform
Specify a lower bound xo and an upper bound x1 of the distribution. The probability density is defined as:
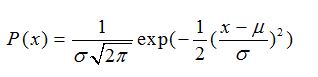
Normal
Specify the mean and standard deviation. The distribution is defined by the probability density function:
Log-normal
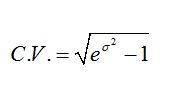
Specify the median and arithmetic coefficient of variation C.V. The probability density is defined as:
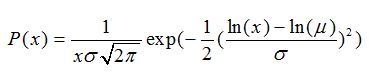
and
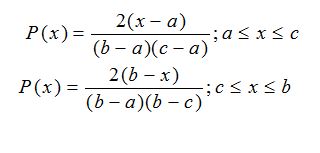
Triangular
Specify (a) location (minimum), (b) scale (maximum) and (c) shape (maximal probability). The probability density varies between the minimum and maximum values and has maximum probability at the ‘shape’. It is defined as:
Running simulations using the DustEx application
Running a simulation requires two steps:
- specifying the input parameters for the model in the ‘Input’ section of the web application
- pressing the ‘Simulate’ button and studying the ‘Results’ section
After running the simulation, DustEx presents different output results, depending on the type of exposure calculation.
Deterministic input
Deterministic input values are specified by entering the values in the parameter edits for each parameter. Some parameters have limits on the validity of their inputs. Entering a value outside the range of validity of the parameter will result in an error message when trying to simulate the scenario.
Scenario settings
In addition to specifying the inputs of model parameters, the user must specify details on the scenario that is simulated. These are found in the section ‘Simulation’. Settings include:
- Simulation duration
The number of days the scenario is to be simulated (between 10 and 999)
- Exposure frequency
The frequency with which an exposed person is assumed to enter the residence where the product is introduced (maximum 365 per year)
- Start of exposure
This parameter can be used to simulate a person entering a number of days after instalment of the product
- Exposure duration on the day of exposure
The number of hours a person is assumed to be exposed on every day he enters the residence
Probabilistic input
Most parameters can be given a probability distribution as an input rather than a deterministic value. This can be done by pressing ^ Distributions button next to the parameter. This will unfold the distribution editor, that can be filled in to specify a distribution. A description of the probability distributions that are supported is given in the section on uncertainty analysis.
When at least one parameter is specified as a distribution, DustEx will conduct a probabilistic simulation. In this case, an extra input section ‘Monte Carlo simulation’ becomes available. Here the assessor can specify the number of samples that is drawn in the Monte Carlo simulation. This number must be between 1000 and 10 000.
In sampling from an input distribution, the DustEx Web application will consider the validity range of the input parameter. If a value outside of the validity range is sampled, the sample is rejected and a new sample is drawn.
When the user wants to go back to a deterministic calculation, the individually selected distributions have to be set to ‘none’.
The DustEx web application will show the following exposure measures as output:
Events doses and time plots
A table gives the events doses: “Daily average absorbed amounts” and “Daily average absorbed doses”.
These are the amounts absorbed on each day of exposure averaged over the entire exposure duration (daily average absorbed amount) and this value divided by the body weight (daily average dose) respectively. Daily average absorbed amounts and doses are given for each of the pathways inhalation gas phase, inhalation with airborne particles, dermal absorption and ingestion with dust. Also the total daily average absorbed amounts and doses summed over all pathways is given.
For a deterministic evaluation, time plots of concentrations in the different compartments and absorbed amounts or doses are presented over the entire exposure duration. The latter are presented in a stacked plot, so that relative contributions can easily be seen.
Distributions
If a probabilistic evaluation is performed, the application calculates distributions of the average daily absorbed amounts and average daily dose. This is done for each of the pathways inhalation of gas phase substance, inhalation of particle bound substance, dermal absorption and ingestion with dust, as well as for the total exposure. Summaries of the calculated distributions are tabulated. These present median, 95th and 99th percentiles of the distributions.
In addition, a cumulative plot of the distribution of the exposure per pathway is plotted. This cumulative plot plots exposure on the x-axis and the fraction of the population that has exposure below that exposure level on the y-axis. A cumulative plot allows one to read off directly any percentile of the exposure distribution.
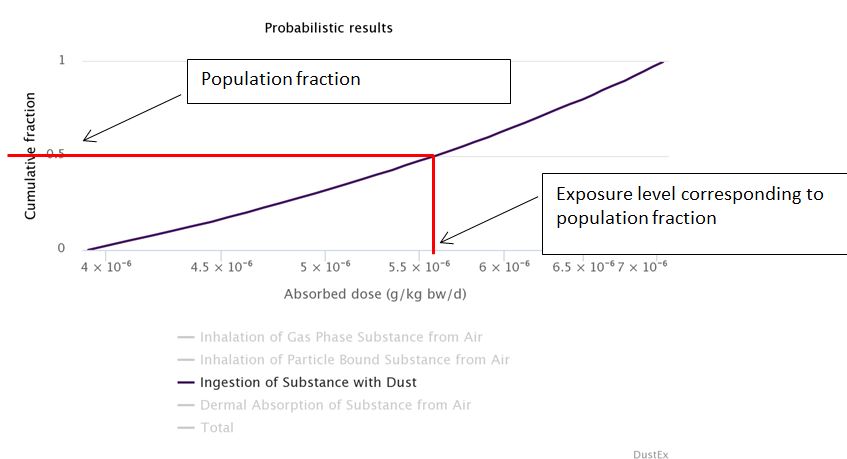
The cumulative plot in the picture above shows the distribution of dose due to dust ingestion in the population. Any percentile of the dose distribution in the population can be read-off from the point in the graph for which the y-value corresponds to the required proportion of the population, as the x-value of this point gives the corresponding dose level.
 Exporting an printing results
Graphs can be exported or printed by clicking on the ‘menu- bars’ ( the icon) at the top right of the graph (Note: make sure to set the cell number format in Excel to ‘scientific’ in order to display the data correctly). Clicking on ‘Print this page’ at the bottom of the web-pages gives a print of the whole simulation: the input parameters and the resulting tables and graphs, including information on version of the tool.