The ConsExpo nano tool can be used to estimate inhalation exposure to nanomaterials in consumer spray products. To run the model, user input on different aspects is needed. These aspects include e.g. the exposure scenario, the nano material under consideration, details of the simulation and the hazard study (optional). Both deterministic and probabilistic evaluations may be performed. Exposure is presented in different measures, as point values, time plots, plots of the probability in case of probabilistic evaluation.
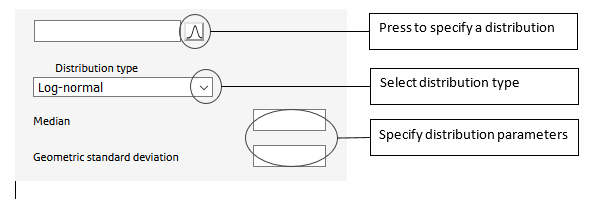
An assessment is defined by specifying input for all model parameters in ConsExpo nano. Values can be single (point) values in which case a deterministic evaluation is performed: ConsExpo nano provides single numbers as an estimate of exposure. Alternatively, probabilistic assessments can be conducted. This is done by providing a probability distribution as input. A set of parameters feature a button next to the value edit control. Pressing this, opens a distribution editor where distributions can be specified. For a description of the supported distributions and the parameters they require for input, see probabilistic evaluations in “Modelling exposure to nanomaterials in spray products ”.
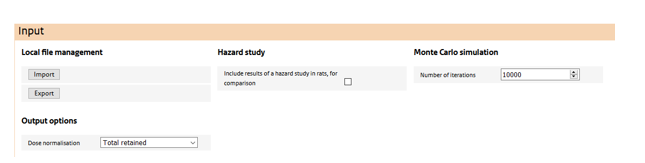
The top most section features:
Local file management
The user may store and retrieve assessments via the ‘import’ and ‘export’ buttons.
Inclusion of a hazard study in the simulation
Via the ‘include hazard study’ check box, the user may include a retained dose simulation from dose-response study in rat. Doing so allows the comparison of human and rat doses on any dose metric and normalisation, to better gauge the human exposure with doses at which toxicological responses are observed in the rat.
Monte Carlo settings
When at least one of the input parameters in the ‘Exposure’ settings has been quantified using a probability distribution, this section becomes visible. Here, the number of Monte Carlo samples is specified. Note that a Monte Carlo simulation cannot be conducted in conjunction with a ‘hazard study’.
Dose normalisation
Here a dose normalisation can be selected from a drop-down list. Depending on the choice, additional input is required on physiological parameters of human or, if a hazard study is also included in the simulation, of the rat. ConsExpo nano provides default values for all these parameters, but these may be overridden by the user. Outputs of the simulation will be generated for the selected normalisation only. If, afterwards, output is required in a different normalisation, the simulation has to be redone using a different normalisation.
In the ‘Exposure’ section of the input, the human exposure assesment factors are specified. The exposure section consists of different sub sections, that refer to different aspects of the assessment.
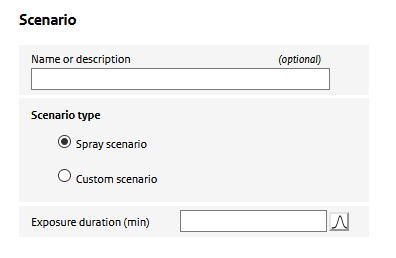
Here, the user specifies a name of the scenario and the type of scenario: whether a spray scenario is defined using the ConsExpo ‘exposure to spray’ model or whether a ‘custom scenario is defined’. Depending on the selected scenario type, the required input changes.
In case of a ‘custom scenario’, the user is asked to specify an ‘air concentration’, In the ‘exposure to spray’ option, the air concencentration is simulated using the ConsExpo spray model. To parameterize this model, special sections (‘spray’, ’usage’ and ‘room’) for parametrizing the model are enabled.
Also in this section, the user specifies the exposure duration: the period a person is present in the room where the spray was used. In this period the person is potentially exposed to the aerosol (and nano-) particles released from the spray.
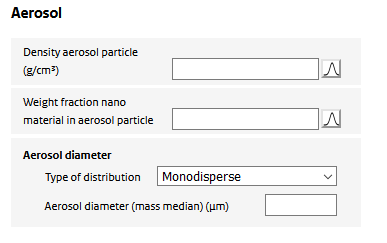
Upon spraying, the nanomaterial is assumed to be dispersed in indoor are as part of particles in the generated aerosol. For the model calculations, the aerosol containing the nano material is to be characterized. The following input is required:
Density aerosol Particle
The mass density of the airborne aerosol particle generated by the product. It depends on the mass density of the nanomaterial itself and the stacking of nanoparticles (or their aggregates) in the aerosol particle. Could be set to the density of the nanomaterial if unknown.
Weight fraction nano material in aerosol particle
The aerosol particle may consist of multiple non-volatile substances, one of which is the nano material. The fraction of the nano material is specified using this parameter. It could be set to 1 if no information on the composition of the aerosol is known.
Finally, the aerosol size needs to be characterized. The size of the aerosol is important for two reasons. First it determines how long the aerosol will be airborne. A smaller aerosol will be airborne for a longer stretch of time and thus have a higher potential for inhalation. Second, once inhaled, the aerosol size will determine its deposition in the respiratory tract and therefore its potential to reach the alveoli.
Aerosol diameter
The aerosol is assumed to consist of spherical particles, the geometry of which is uniquely determined by its diameter. The diameter of the sprayed aerosol may be represented by a single number (a ‘monodisperse’ distribution) or as a (mass-based) lognormal distribution. In the case of a ‘monodisperse’ distribution, the aerosol diameter is specified by the value of the parameter ‘Aerosol diameter (mass median)’. In case of a ‘log normal’ distribution, the distribution is specified by the ‘Aerosol diameter (median)’, the ‘arithmetic coefficient of variation’ (defined as the arithmetic standard deviation divided by the mean). The distribution is taken to range from 0 to the ‘Maximum aerosol diameter’, above which the distribution is truncated.
A ‘non-parametric’ distribution enables the use of raw measurement data. Input can be uploaded using a text file from the local file system by pressing the ‘manage’ button. This button becomes accessible after selection of ‘non-parametric’.
To upload a non-parametric distribution, a text file should be prepared according to the following format:
- The file should contain two headerless columns, separated by a single 'tab'.
- The first column specifies the diameter bin as the upper bound of the size bin in µm. The lower bound of the bin is assumed to be the upper bound of the previous bin. The lower bound for the first bin is taken to be 0.
- The second column should contain the fraction of the total mass in the bin. If the total fraction of all bins is larger than 1, the distribution will automatically be normalized to 1 on import. A total fraction < 1 is accepted as valid input, however.
- Separating decimals can be done using either ',' or '.' as a separator.
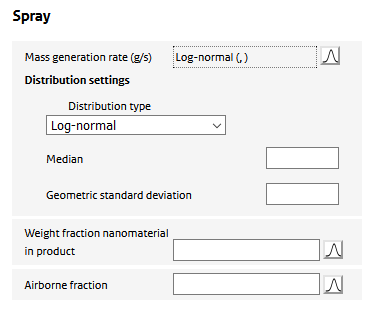
In case the scenario type ‘exposure to spray’ is used to simulate exposure, characteristics of the spray product and how it is used are needed. The spray product and use parameters determine the amount of material that becomes available for inhalation.
The amount released from a spray is determined by its mass generation rate and the time duration of the use of the spray (i.e. how long the product is sprayed.) The emitted product will be a mixture of various compounds such as propellants, solvents and the nanomaterial itself. Only the non-volatile components of the product will end up as airborne aerosol particles as the volatile components will vaporize and be released as a gas.
To specify the product the following input is required:
Mass generation rate
The amount of product released per unit time. The product will generally contain different components (e.g. propellant gas, solvents, the (non-volatile) nanomaterial itself.) The mass generation refers to the mass of this complete mixture. It is the value that would be measured when measuring the spray before use and after use divided by the time it was operated.
Weight fraction nanomaterial
The fraction of the nanomaterial mass of the total product mass (as it is contained in the spray can).
Airborne fraction
The fraction that accounts for the fact that in using a spray on a surface, only part of the spray will end up as airborne aerosol, as the bulk of the material will end up on the treated surface. For an air space application (e.g. spray against flying insects, air freshener) the fraction will be close to 1. For a surface spray (e.g. a plant spray, all-purpose cleaner), this fraction will be much lower. See (Delmaar & Bremmer, 2010) for estimated values for this parameter for different sprays.
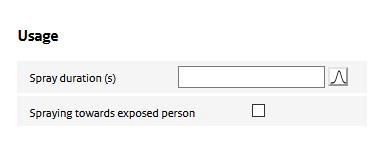
Usage of the spray determines for a large part the exposure potential. ‘Usage’ parameters define how long a spray is used, the proximity of use to the exposed person, and how much of the sprayed aerosol particles end up in the room air.
Spraying towards exposed person
This option allows to account for the situation in which the spray is used directly in the breathing zone of the exposed person (e.g. for a hair spray or deodorant.)
Cloud volume
In case the spray is used on a person, the distribution volume of the aerosol is reduced during spraying. The cloud volume is the volume after 1 second of spraying. For each second of spraying the distribution volume of the aerosol is assumed to increase by this volume.
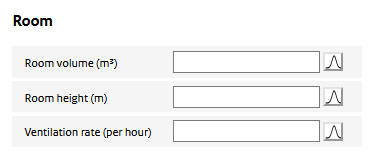
Consumer sprays are assumed to be used indoors. Features of the indoor environment such as room size and ventilation determine to a large extent the resulting aerosol air concentrations. The following parameters need to be specified:
Room volume
The volume of the room where the spray is used. The sprayed aerosol is assumed to be homogeneously distributed throughout the room after spraying.
Room height
The height of the room. The sprayed aerosol is assumed to be distributed homogeneously over this height. It may be more appropriate in cases where the spray is not directed upwards, to use the release height of the spray rather than the actual height of the room itself.
Ventilation rate
The number of times the air in the room is refreshed per hour.
Parameters used to specify the nano material:
Nanomaterial diameter
Primary diameter of the nanomaterial.
Density nanomaterial
The mass density of the nanomaterial.
Type of distribution
The geometry of the nano material is defined by the shape and size of the constituting nano particles. The size may be represented by a single number (a ‘monodisperse’ distribution) or as a (mass-based) lognormal distribution.
In the case of a ‘monodisperse’ distribution, the nano material is specified by the particle geometry parameters defined under the ‘shape’. In case of a ‘log normal’ distribution, the distribution is assumed to be a lognormal distribution of the mass of the particles. The median mass is assumed to be the mass of the particle specified by the ‘shape’ parameters. The dispersion of probability distribution of the mass of the nano material is specified by the ‘arithmetic coefficient of variation’ (defined as the arithmetic standard deviation divided by the mean). In the distribution, the aspect ratio’s defined in the shape are assumed to be constant, and the variation is only in the total volume of the particle (so, the particles are all of similar shape, just varying in total volume.)
Shape nano particle
Used to define the shape of the nanoparticle. There are three options:
- Spherical: the particle geometry is defined by its diameter.
- Cylindrical: the particle geometry is determined by the radius and height.
- Sheet: the particle geometry is specified by the ‘nanoparticle thickness’ and the single sided ‘nanoparticle surface area’. The volume is taken to be the thickness times the single sided surface area. The particle surface is assumed to be twice the single sided surface area (i.e. negligible thickness.
Nanomaterial soluble
The user can specify whether the nanomaterial is soluble in the alveolar macrophages. Only materials with a low rate of dissolution can be modelled using the ConsExpo nano tool as the deposition model is valid only for poorly soluble particles.
Dissolution rate
The fraction of materials that dissolves in the macrophage per unit of time. The tool allows only moderate dissolution rates (between 0.0001 per day and 0.05 per day.)
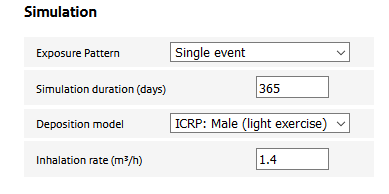
In this section, the user specifies details of the simulation. Input for the following parameters needs to be provided:
Simulation duration
The total period the load in the alveoli is to be estimated. Note that the clearance of non-soluble particulate matter from the lung is generally slow and residues of inhaled material may be present in the alveoli for substantial time after the actual exposure has taken place.
Exposure pattern
This parameter defines whether the exposure takes place repeatedly or not. Options are:
- Single event: exposure takes place only once.
- Repeated (unlimited): exposure takes place with a fixed frequency (to be specified by the user)
- Repeated (fixed number of times): exposure is repeated with a user-specified frequency for a number of times and then stops. User specifies the ‘number of exposure events’ parameter.
Deposition model
The user has a choice between two parameterisations of the ICRP deposition model: ‘male (light exercise)’ and ‘female (light exercise)’
Inhalation rate
Volume of inhaled air per hour. Combined with the air concentration this gives the inhaled dose.
If, in the ‘gerenal assessment settings’ it has been indicated that a hazard study should be included, the retained dose in a rat (dose-response) study will be simulated along with the human retained dose. This allows for a more direct comparison of man and rat exposures.
The following input is required:
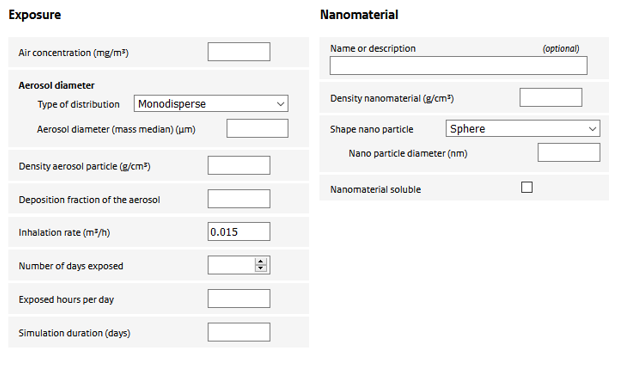
Exposure
Air concentration
Air concentration to which the rat was exposed in the experiment.
The type of distribution
The diameter of the sprayed aerosol may be represented by a single number or as a (mass-based) distribution. In the case of a ‘monodisperse’ distribution, the aerosol diameter is specified by the value of the parameter ‘Aerosol (mass median) diameter (median)’.
A ‘log normal’ distribution is specified by the ‘Aerosol diameter (median)’, the ‘Geometric standard deviation (GSD)’. The distribution is taken to range from 0 to the ‘Maximum aerosol diameter’, above which the distribution is truncated.
Aerosol diameter
The diameter of the aerosol. Can be a single value or a distribution.
Density aerosol particle
The effective mass density of the aerosol particle used in the experiment. It depends on the mass density of the nanomaterial itself and the stacking of nanoparticles (or their aggregates) in the aerosol particle. Could be set to the density of the nanomaterial if unknown.
Deposition fraction of aerosol
Depending on the diameter and density of the aerosol particle, breathing pattern and rat strain, inhaled particles have a varying potential to reach the alveolar region. The user is required to provide an estimate of the deposition fraction. To estimate the deposition fraction, the user is referred to the (freely available) Multi-Pathway-Particle-Deposition (MPPD) model (www.ara.com/capabilities/inhalation-and-respiratory-mechanics).
Inhalation rate
Volume of inhaled air per hour. Combined with the air concentration this gives the inhaled dose.
Number of days exposed
The number of days the animals were exposed in the experiment. Note that the experimental exposure is assumed to have been continuous. If, for example, an exposure regime of 5 days a week, 6 hours a day) was applied, this should be accounted for in ConsExpo nano by simulating 7 days in the week, but adjusting the exposure hours per day so that the total hours correspond to the study (in the example, the number of hours should be set to 5/7 x 6 = 4.3 hours).
Exposed hours per day
Number of hours the animals have been exposed on an exposure day.
Simulation duration
Total number of days the simulation needs to cover. This may include an exposure and a post-exposure (recovery) period.
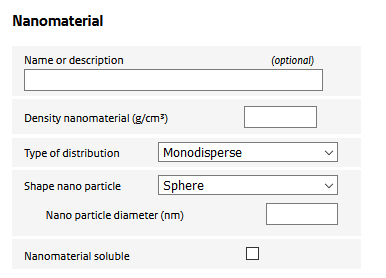
Nanomaterial
Name or description
Optional field to provide a description of the material under consideration
Density nanomaterial
The mass density of the nanomaterial.
Shape nano particle
Used to define the shape of the nanoparticle. There are three options:
- Spherical: the particle geometry is defined by its diameter
- Cylindrical: the particle geometry is determined by the radius and height
- Sheet: the particle geometry is specified by the ‘nanoparticle thickness’ and the single sided ‘nanoparticle surface area’. The volume is taken to be the thickness times the single sided surface area. The particle surface is assumed to be twice the single sided surface area (i.e. negligible thickness.)
Nanomaterial soluble
The user can specify whether the nanomaterial is soluble in the alveolar macrophages. Only materials with a low rate of dissolution can be modelled using the ConsExpo nano tool as the deposition model is valid only for poorly soluble particles.
Dissolution rate
The fraction of materials that dissolves in the macrophage per unit of time. The tool allows only moderate dissolution rates (between 0.0001 per day and 0.05 per day.)
Inhaled dose per event
The total dose of aerosol that is inhaled during a single exposure event. The dose is expressed in different dose measures. For repeated exposure events, the same inhaled dose for each event is assumed.
Alveolar dose per event
The dose of aerosol that, after inhalation in a single exposure event, deposits in the alveoli.
Distributions
In this section the dependence of a number of exposure measures on the diameter of the inhaled aerosol is shown. The plots include the inhaled dose during an exposure event versus the diameter, the deposition fraction in different regions of the respiratory tract as a function of the aerosol diameter and finally, the deposited mass in different regions of the respiratory tract as a function of the aerosol diameter. These graphs are only shown in case the aerosol diameter is represented by a (log normal) distribution.
Dose-time plots
In this section of the output, important exposure estimates are displayed as a function of time. The first graph plots the inhaled and alveolar dose during a single exposure event versus time. The time ranges from zero (the start of the exposure event) to the exposure duration. The second graph shows the alveolar load over the simulation duration. For both graphs the dose measure may be chosen from a drop-down list. Finally, if the solubility of the material is simulated, a graph will appear that shows the (cumulative) amount of nanomaterial that has dissolved in the alveoli since the start of the simulation. Note that the fate (e.g. interstitialisation or systemic uptake) of the dissolved nanomaterial is not considered in the ConsExpo nano tool. The graph is to be interpreted strictly as the amount of nanomaterial (and only nanomaterial) that is present in the alveoli at any particular time. If a simulation of a hazard study is included an additional graph will show the retained dose in the rat alveolar region, for the same dose metric and normalisation as selected for the human. The dose-time plots are not shown for probabilistic simulations.
Distribution plots
For probabilistic evaluations, distribution plots for the sampled distributions of the inhaled and deposited dose are shown. These are in the selected dose metric and normalisations. They present a histogram (frequency distribution versus the retained dose) and a cumulative distribution plot. The distribution plots are not shown for deterministic evaluations.